
Overview
Linear regression is a method to best fit a linear equation, or a straight line, of the form $$y(x) = a + bx$$ to a collection of n points $$(x, y)$$, where $$b$$ is the slope and $$a$$ the intercept on the y-axis.
Discussion
In the following implementation, the result will be stated below without derivation, that requires minimization of the sum of the squared distance from the data points and the proposed line. This function is minimized by calculating the derivative with respect to a and b and setting these to zero.
This method assumes there is no known variance for the x and y values. There are solutions which can take this into account, this is particularly important if some values are known with less error than others. Also, this method requires that the slope is not infinite…
' Description:
'   Linear Regression
'   y(x) = a + bx, for n samples.
' Parameters:
'   data - [in]  An array of (x,y) values.
'   a    - [out] The slope.
'   b    - [out] The y-axis intersect.
'   c    - [out] The regression coefficient.
' Returns:
'   True if successful, False otherwise.

Function LinearRegression(ByVal data, ByRef a, ByRef b, ByRef r)

  ' Local variables
  Dim d, x, y, n
  Dim sumx, sumy, sumx2, sumy2, sumxy, sxx, syy, sxy

  ' Initialize variables
  sumx = 0 : sumy = 0 : sumx2 = 0 : sumy2 = 0 : sumxy = 0
  n = UBound(data) + 1

  ' Initialize output
  a = 0 : b = 0 : r = 0

  ' Default return value
  LinearRegression = False

  ' Must have at least two points
  If (n < 2) Then Exit Function

  ' Compute some things we need
  For Each d In data
    x = d(0)
    y = d(1)
    sumx  = sumx  + x
    sumy  = sumy  + y
    sumx2 = sumx2 + (x * x)
    sumy2 = sumy2 + (y * y)
    sumxy = sumxy + (x * y)
  Next

  sxx = sumx2 - (sumx * sumx / n)
  syy = sumy2 - (sumy * sumy / n)
  sxy = sumxy - (sumx * sumy / n)

  ' Infinite slope (b), non existant intercept (a)
  If (Abs(sxx) = 0) Then Exit Function

  ' Compute slope (b) and intercept (a)
  b = sxy / sxx
  a = sumy / n - b * sumx / n

  ' Compute regression coefficient
  If (Abs(syy) = 0) Then
    r = 1
  Else
    r = sxy / Sqr(sxx * syy)
  End If

  LinearRegression = True

End Function
Best Fit
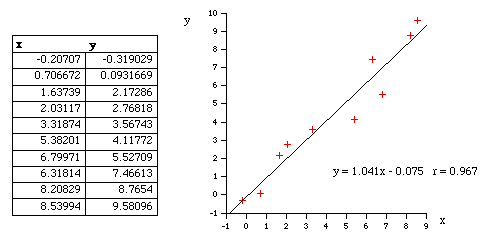
The following example shows the points and the best fit line as determined using the techniques demonstrated above…
Sub Main()

  Dim data(9), a, b, r

  data(0) = Array(-0.20707, -0.319029)
  data(1) = Array(0.706672, 0.0931669)
  data(2) = Array(1.63739, 2.17286)
  data(3) = Array(2.03117, 2.76818)
  data(4) = Array(3.31874, 3.56743)
  data(5) = Array(5.38201, 4.11772)
  data(6) = Array(6.79971, 5.52709)
  data(7) = Array(6.31814, 7.46613)
  data(8) = Array(8.20829, 8.7654)
  data(9) = Array(8.53994, 9.58096)

  If (LinearRegression(data, a, b, r) = True) Then
    Call Rhino.Print("Slope (b) = " & FormatNumber(b, 3))
    Call Rhino.Print("Y Intercept (a) = " & FormatNumber(a, 3))
    Call Rhino.Print("Regression Coefficient = " & FormatNumber(r, 3))
  End If

End Sub
