Debugging Your Scripts
Debugging pauses your script while it runs so you can look at your variables and step through your code line by line. Python and C# scripts can be debugged.
Set at least one breakpoint and choose Run > Debug. Without an active breakpoint in the script, Debug stays disabled.
Three panels show what is going on while the script is paused. Each has its own tray in the console area:
- Window > Toggle Breakpoints Tray
- Window > Toggle Variables Tray
- Window > Toggle Call Stack Tray
Breakpoints
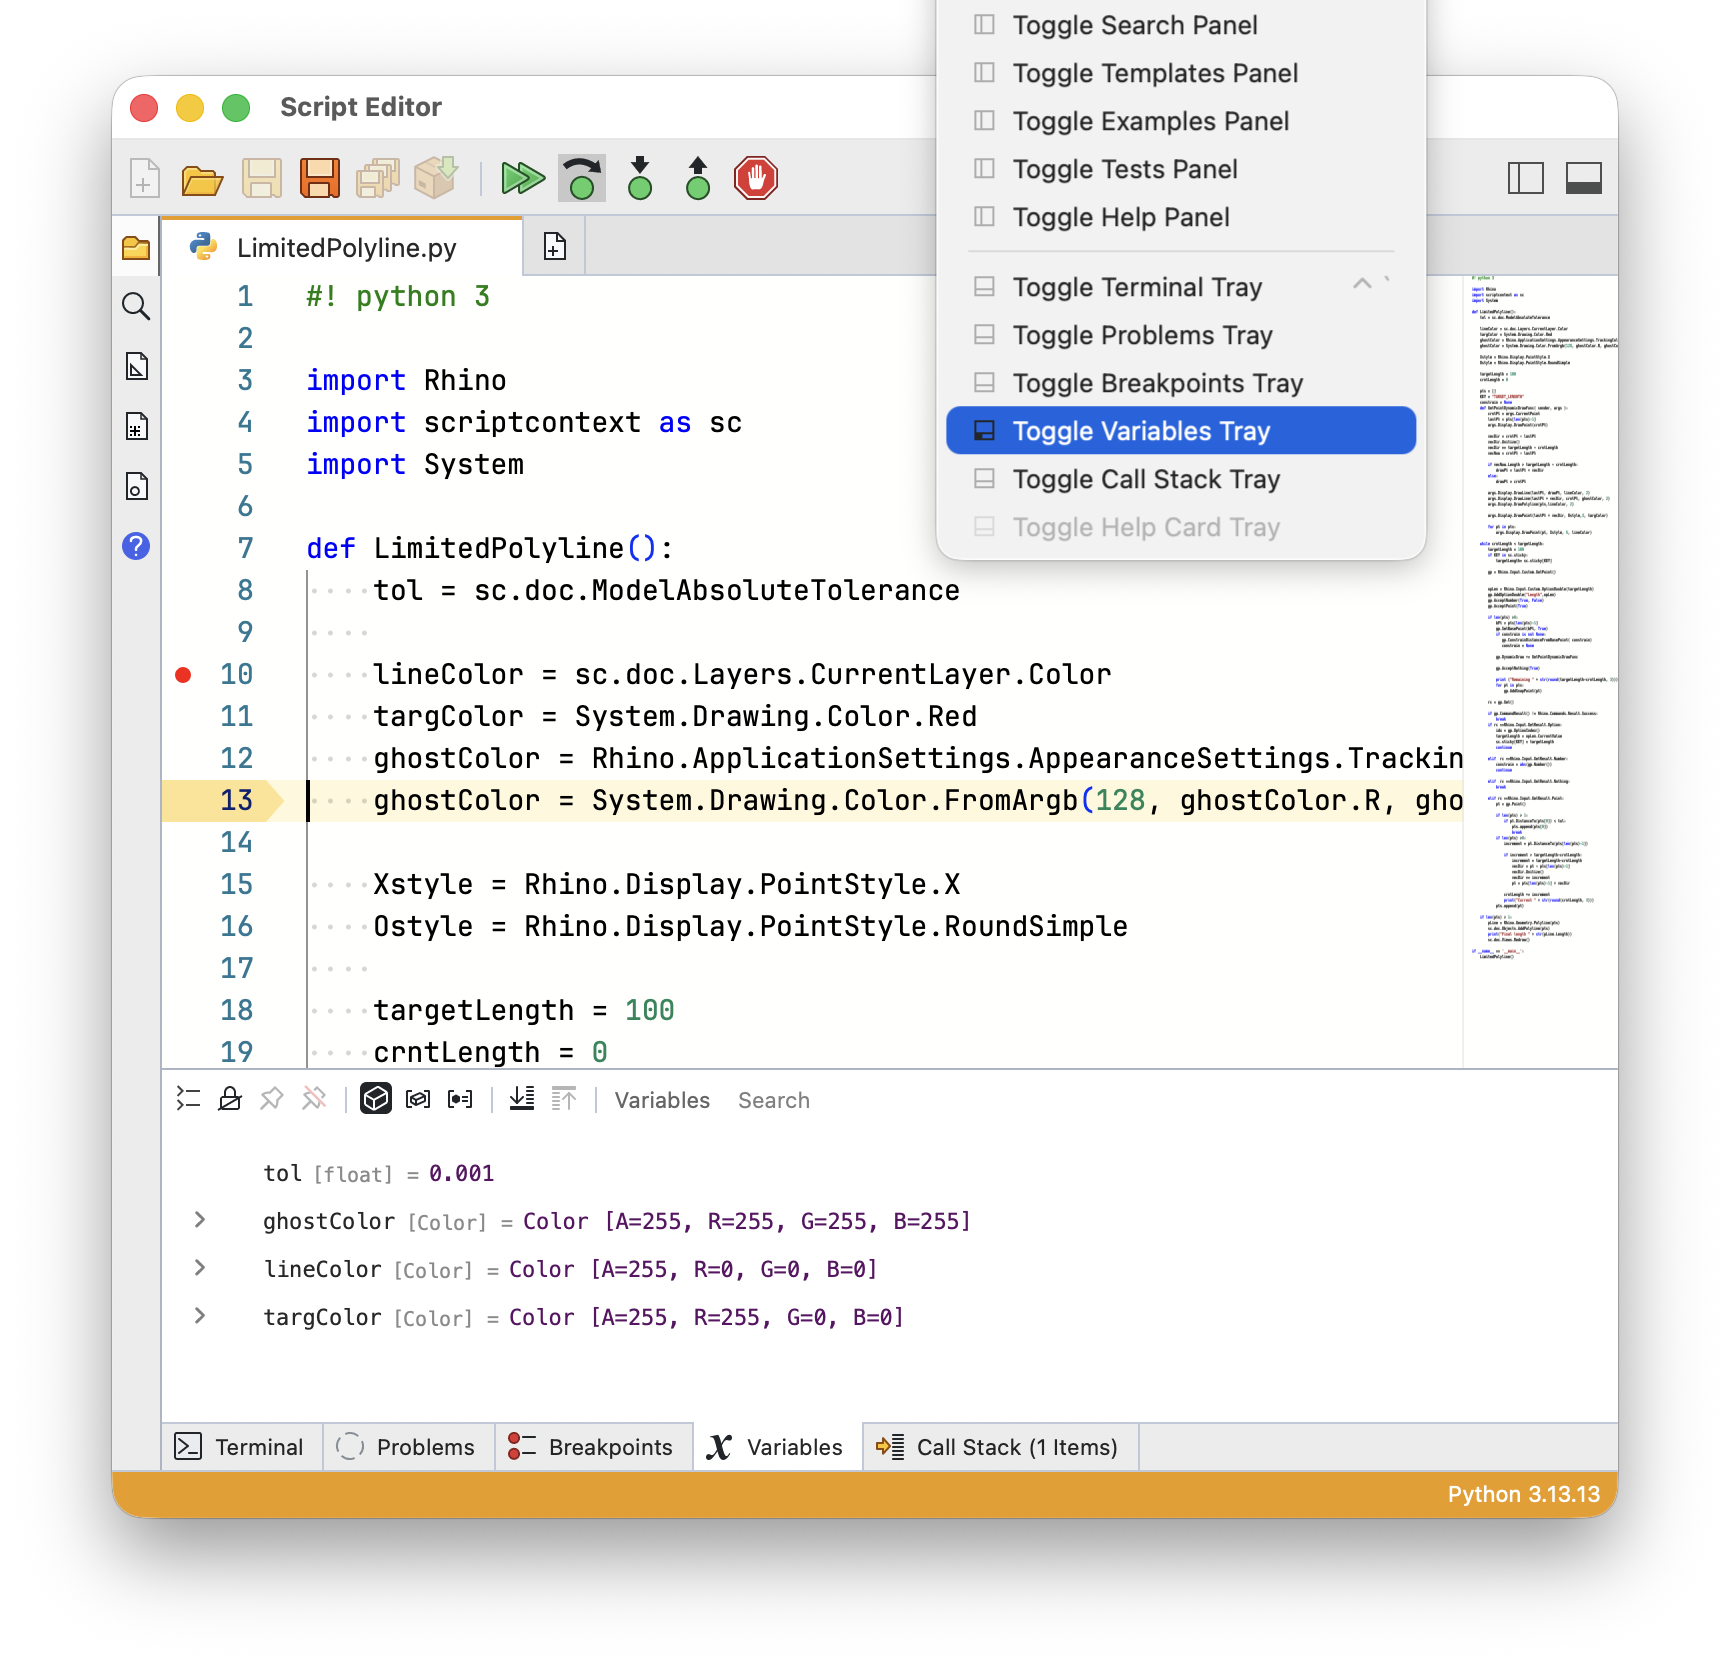
Click the gutter to the left of a line to add or remove a breakpoint:
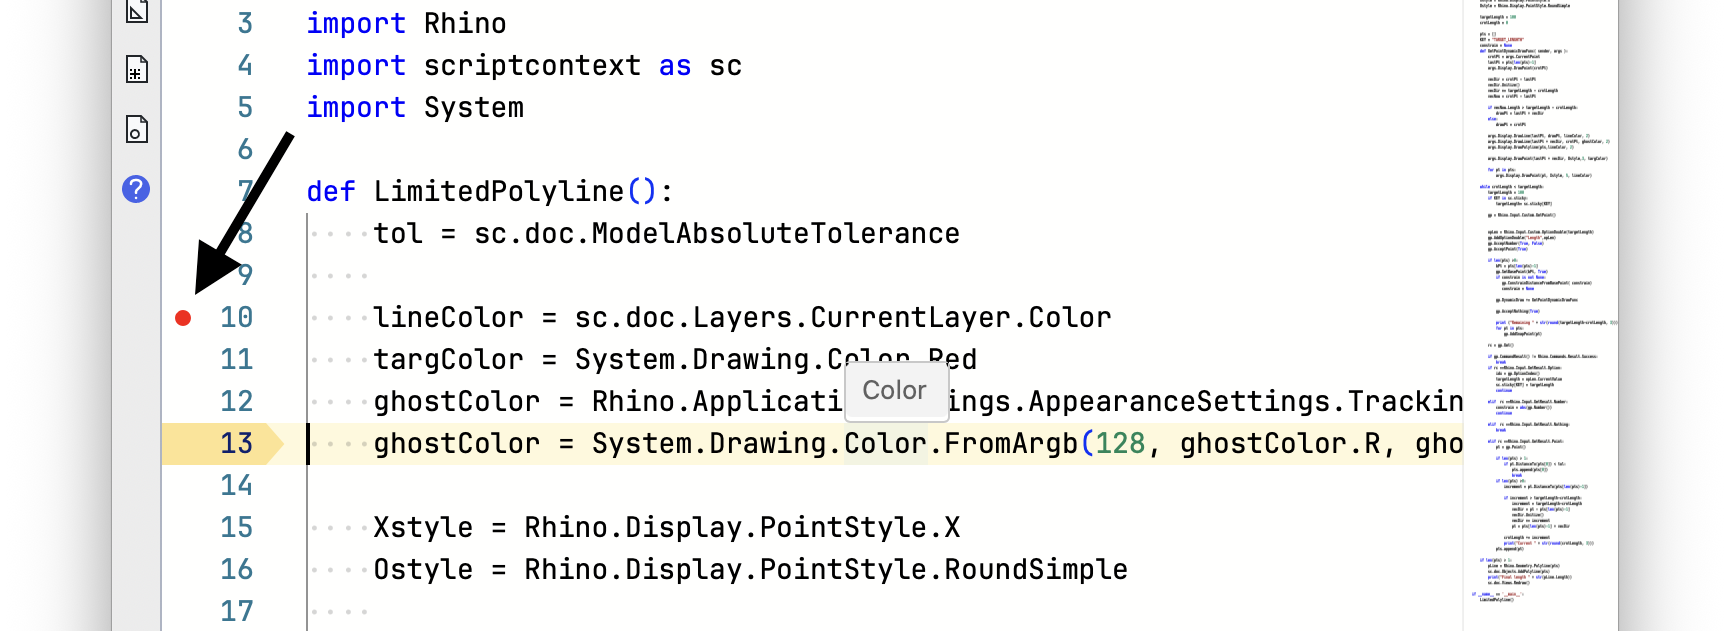
The Breakpoints panel lists every breakpoint you have set. Each row shows the script and the line number. Click the icon on a row to disable that breakpoint without removing it:
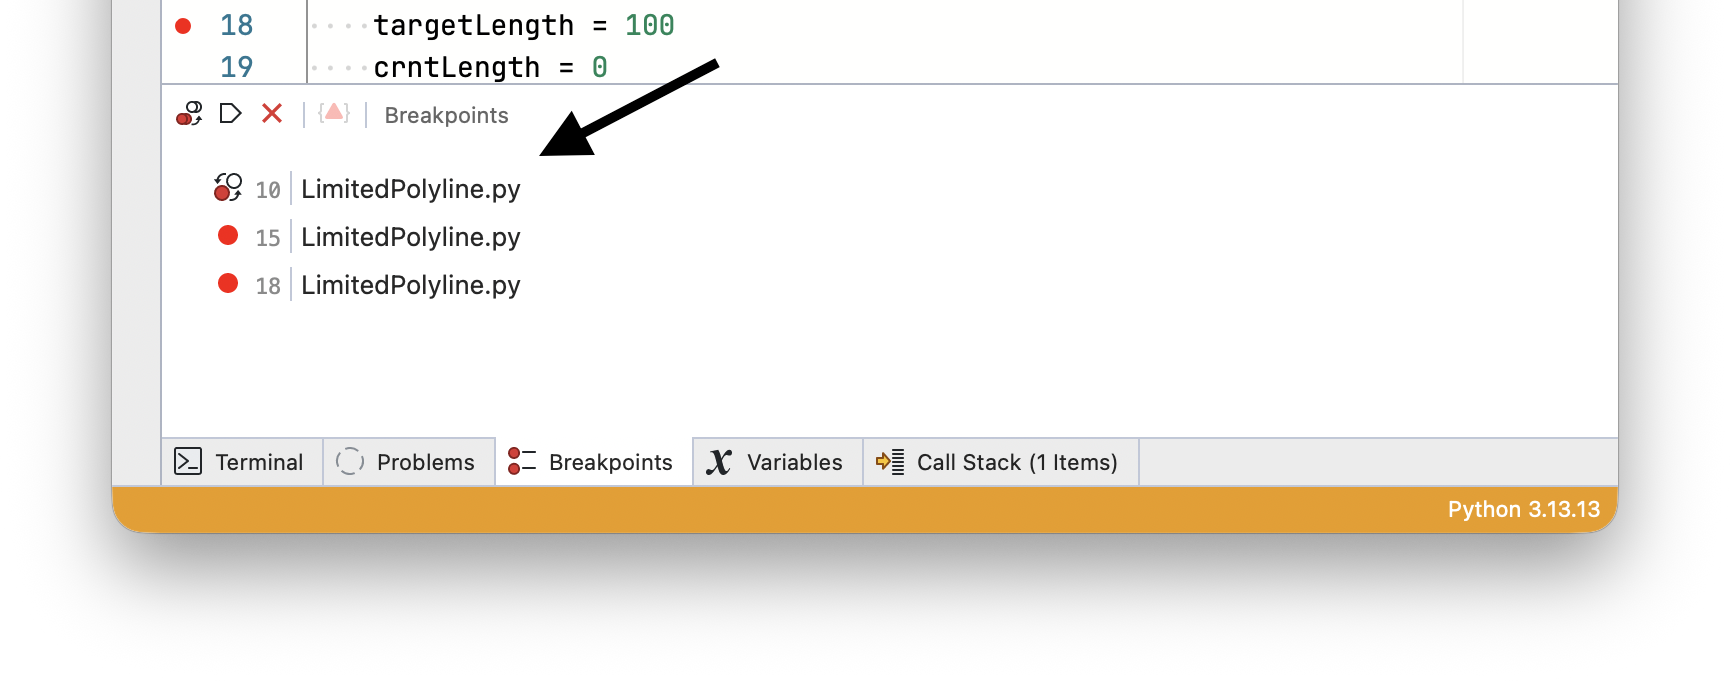
The panel header has:
- Toggle Breakpoints to enable or disable all breakpoints at once
- Toggle Breakpoint Source Lines to show the source line next to each breakpoint
- Remove Breakpoints to remove all of them
Debug Controls
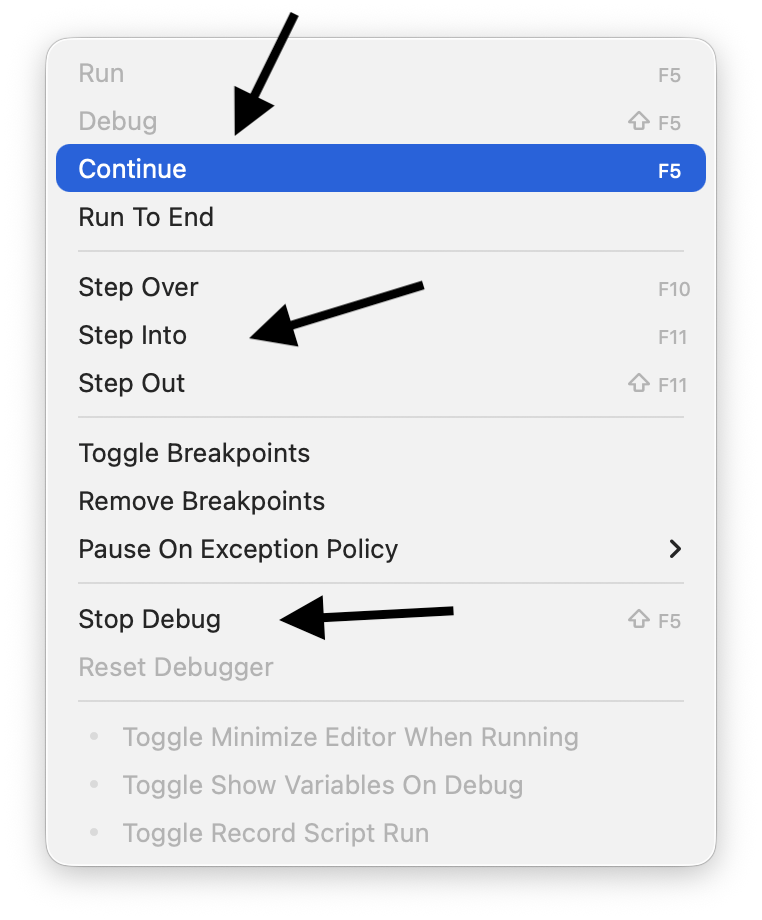
Once the script is paused, use the Run menu to step through it:
| Run > Continue | Runs until the next breakpoint |
| Run > Step Over | Runs the current line |
| Run > Step Into | Steps into the function on the current line |
| Run > Step Out | Runs the rest of the current function |
| Run > Stop Debug | Ends the debug run |
| Run > Reset Debugger | Clears debug results and starts fresh |
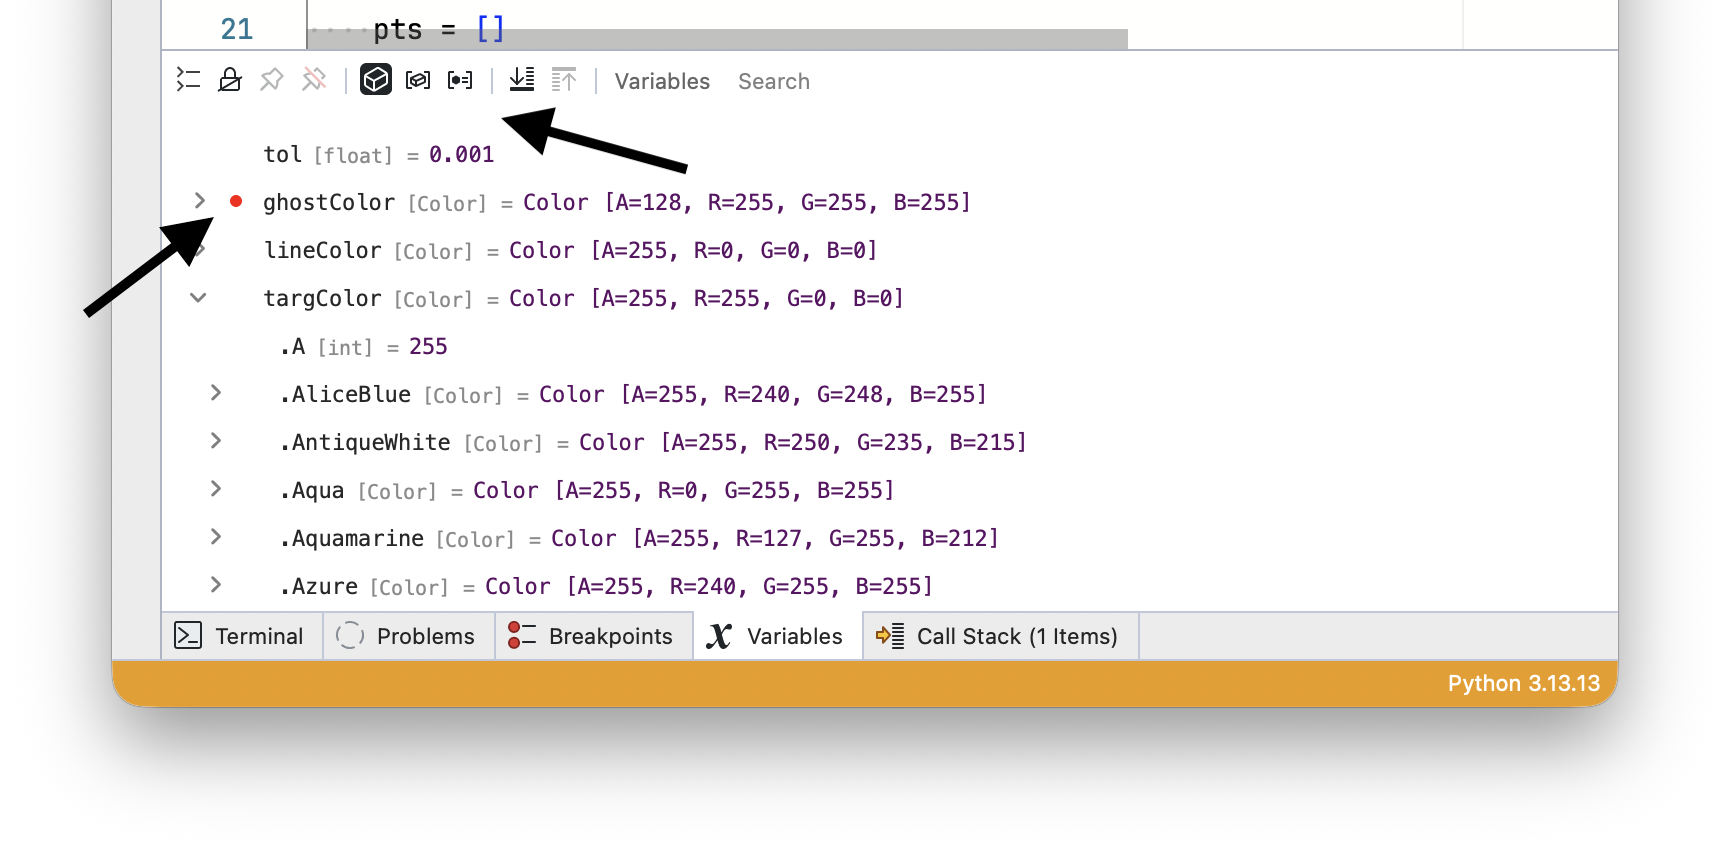
Variables
The Variables panel lists the variables of the paused script, grouped by scope. Values update as you step:
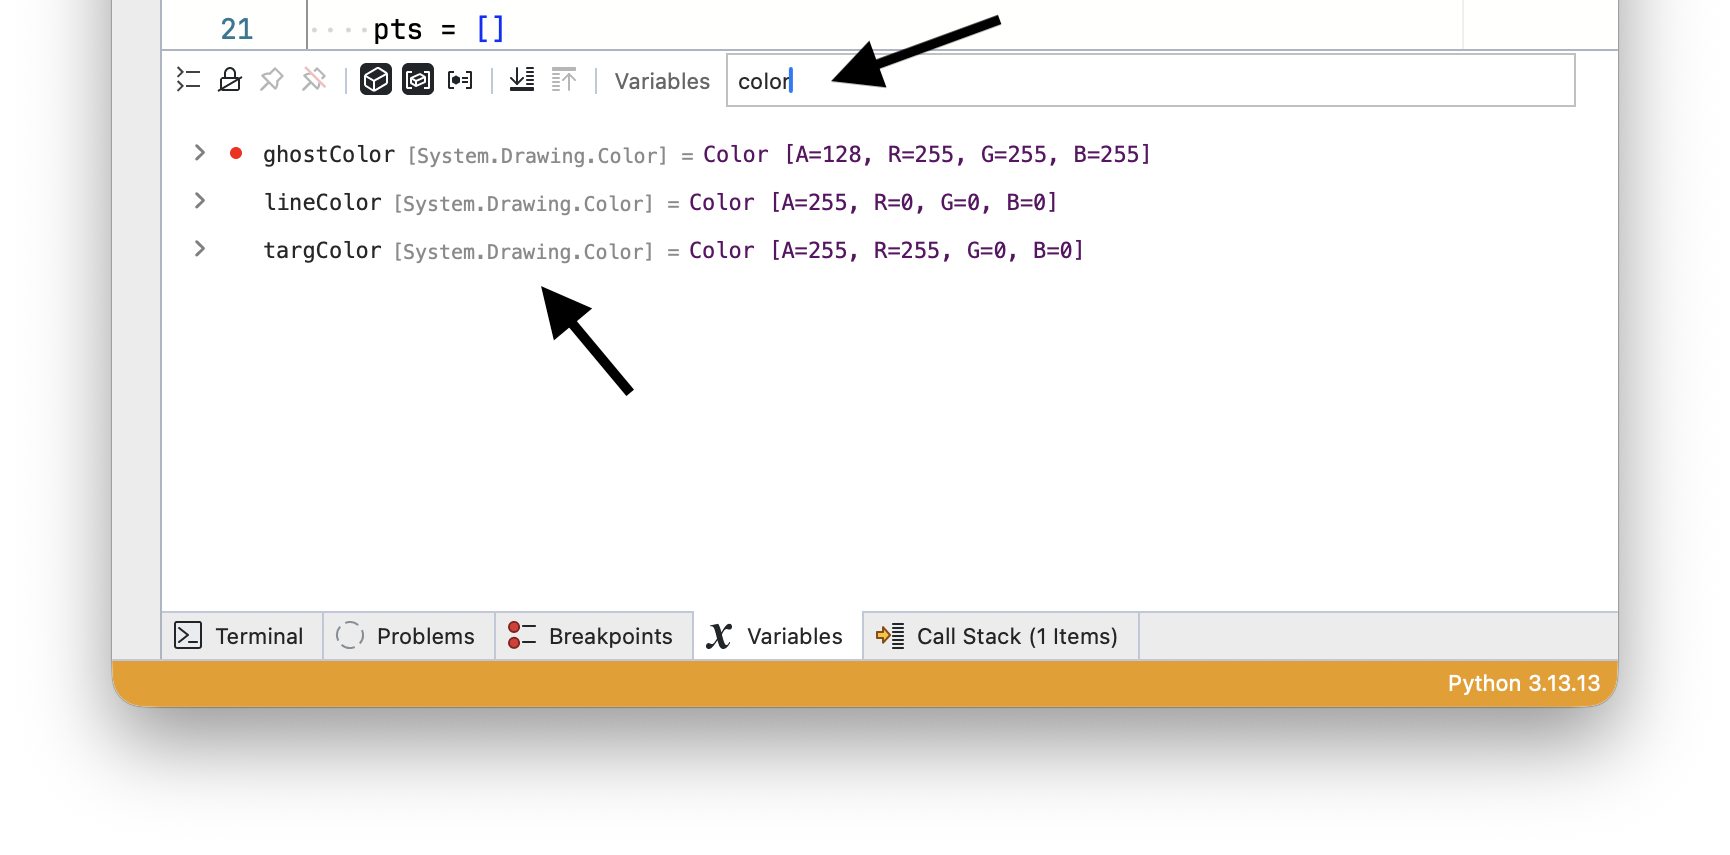
Type in the search box to list only the variables with matching names. Show All Variables clears the search.
The panel header has:
- Show Variable Types to show the type of each variable, and Toggle Variable Types With Namespace to show the full type name
- Toggle Non-Public Variables to also list non-public variables
- Collapse Variables to collapse everything you expanded
- Previous Frame and Next Frame to move between call stack frames
Right-click a variable and choose Copy Value to copy its value.
Pinned Variables
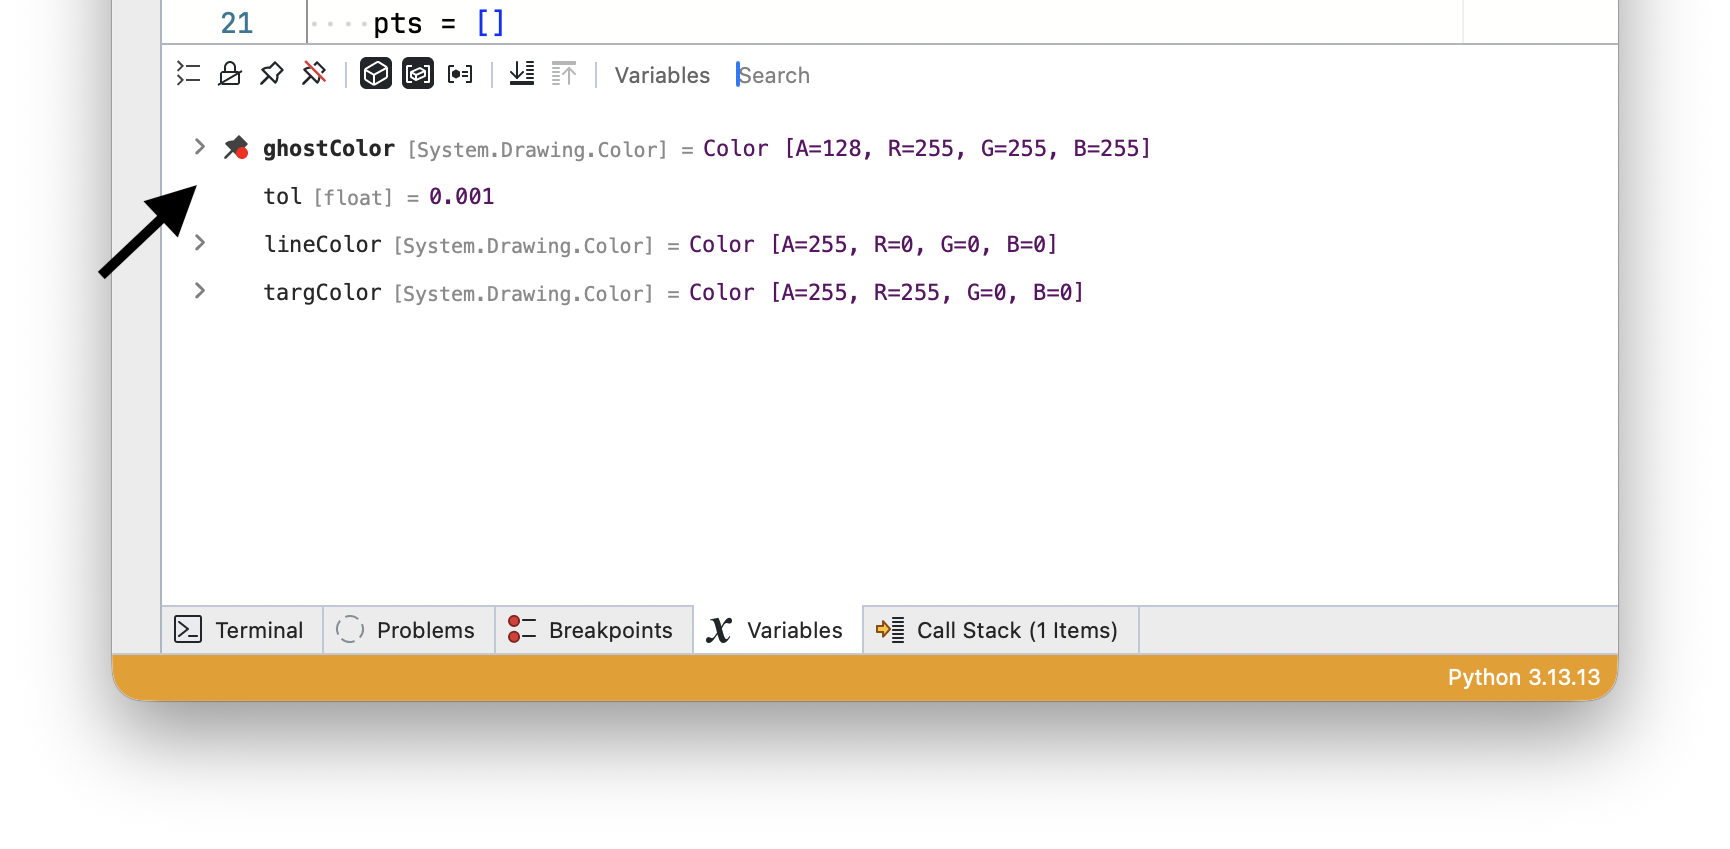
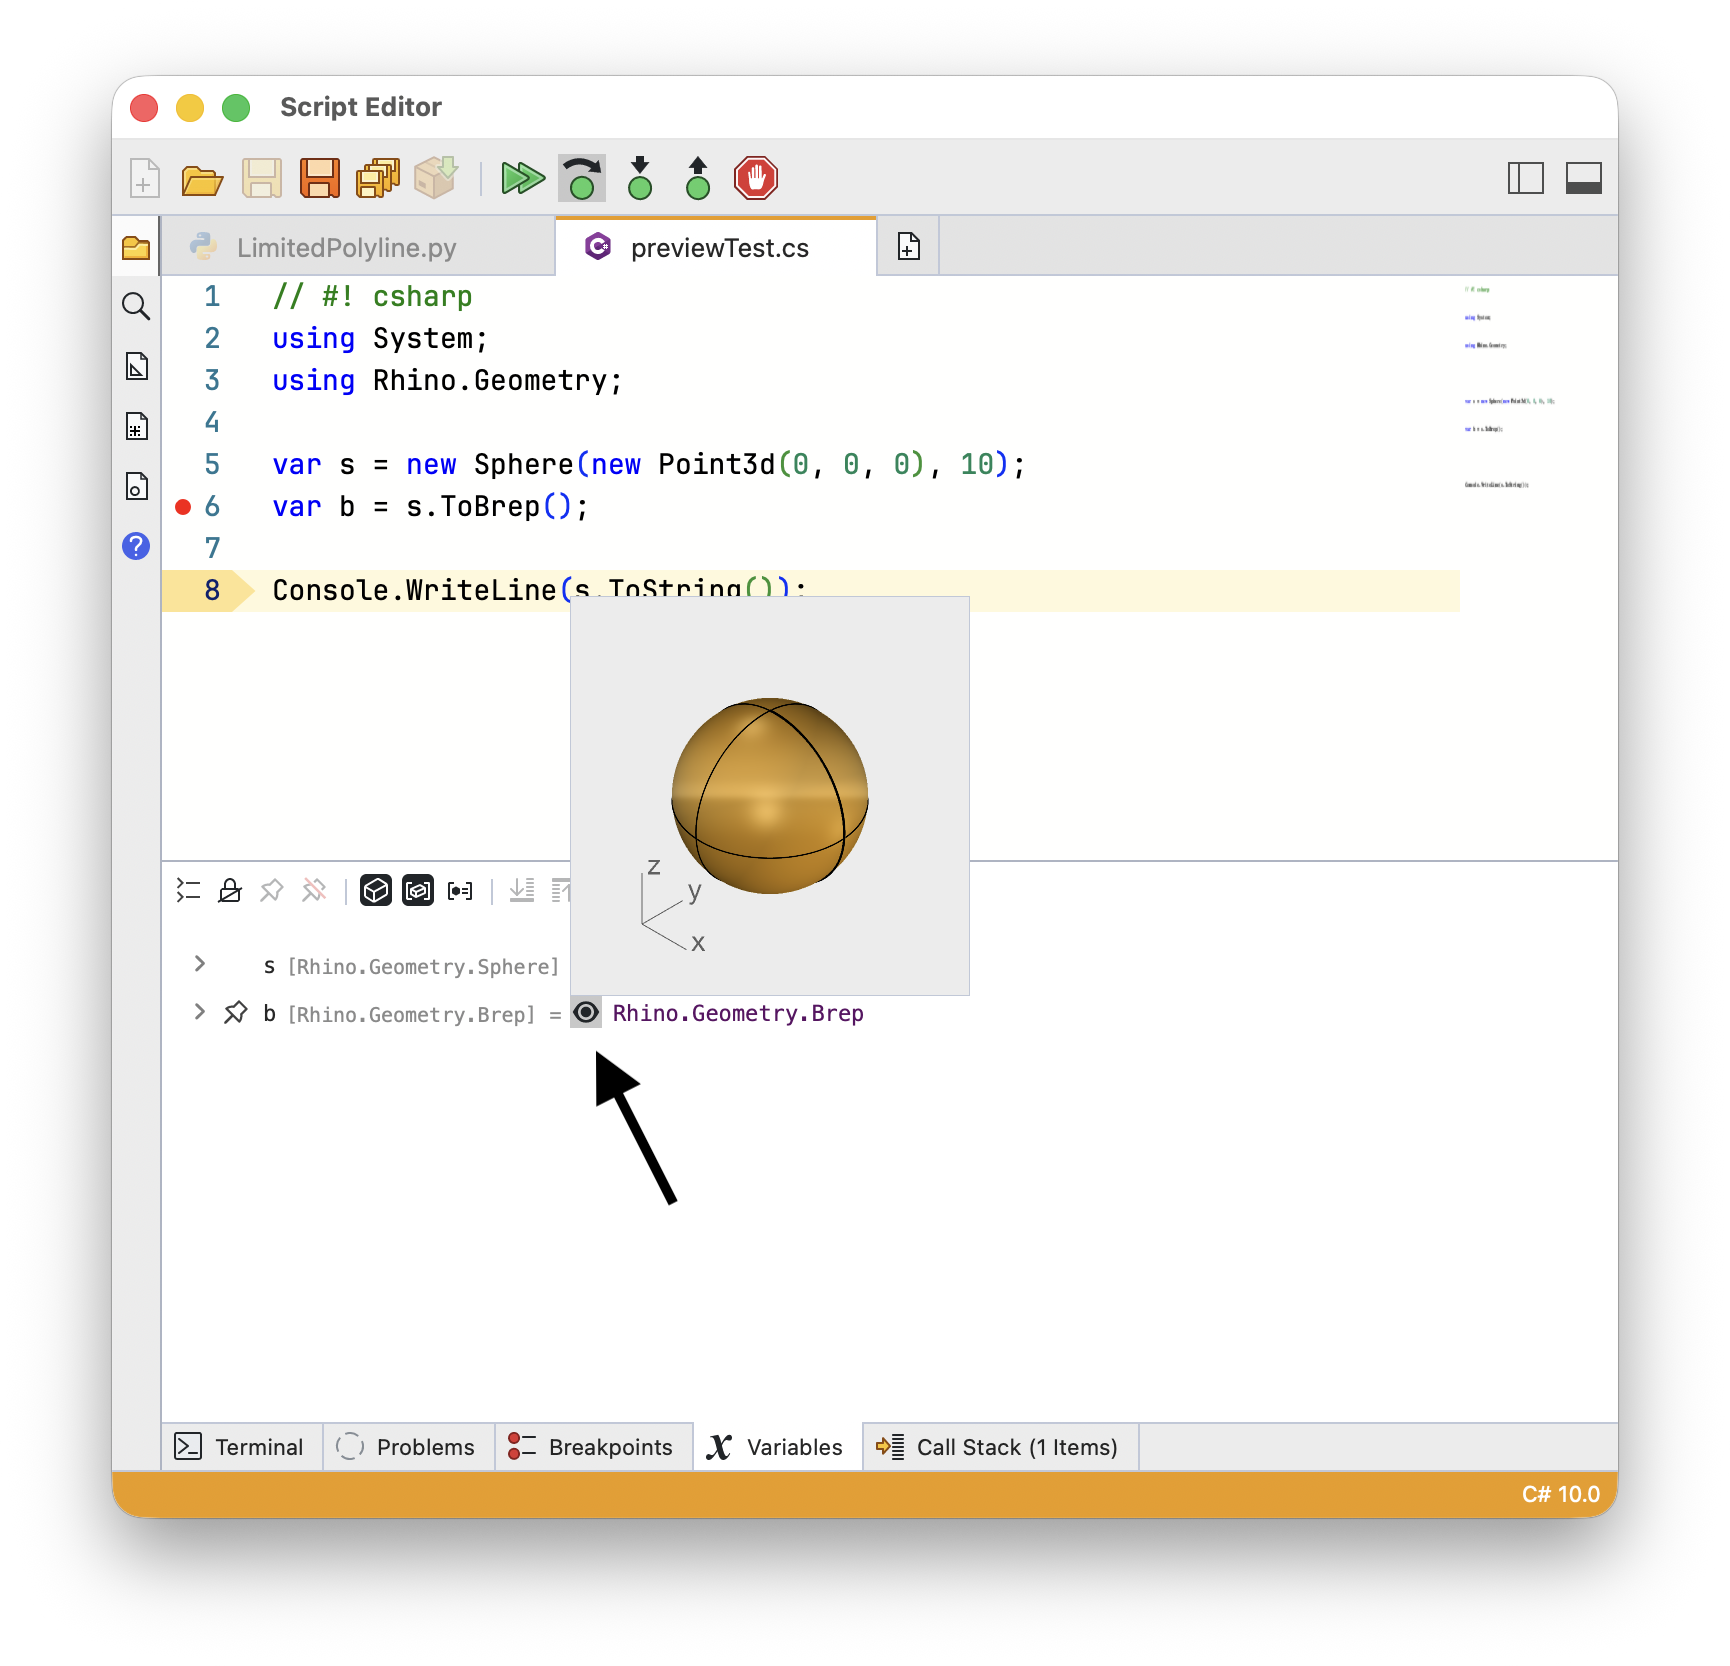
Click the pin on a variable row to keep watching it. Use Toggle Pinned Variables Only to hide everything else, and Unpin All Variables to clear your pins:
Variables holding geometry or a document object can also be previewed in the Rhino viewport:
Choose Run > Toggle Show Variables On Debug to open this panel automatically whenever you debug a script.
Call Stack
The Call Stack panel shows the runs, threads, and frames of your script, and marks where the script is paused. Select a frame to see its variables in the Variables panel:
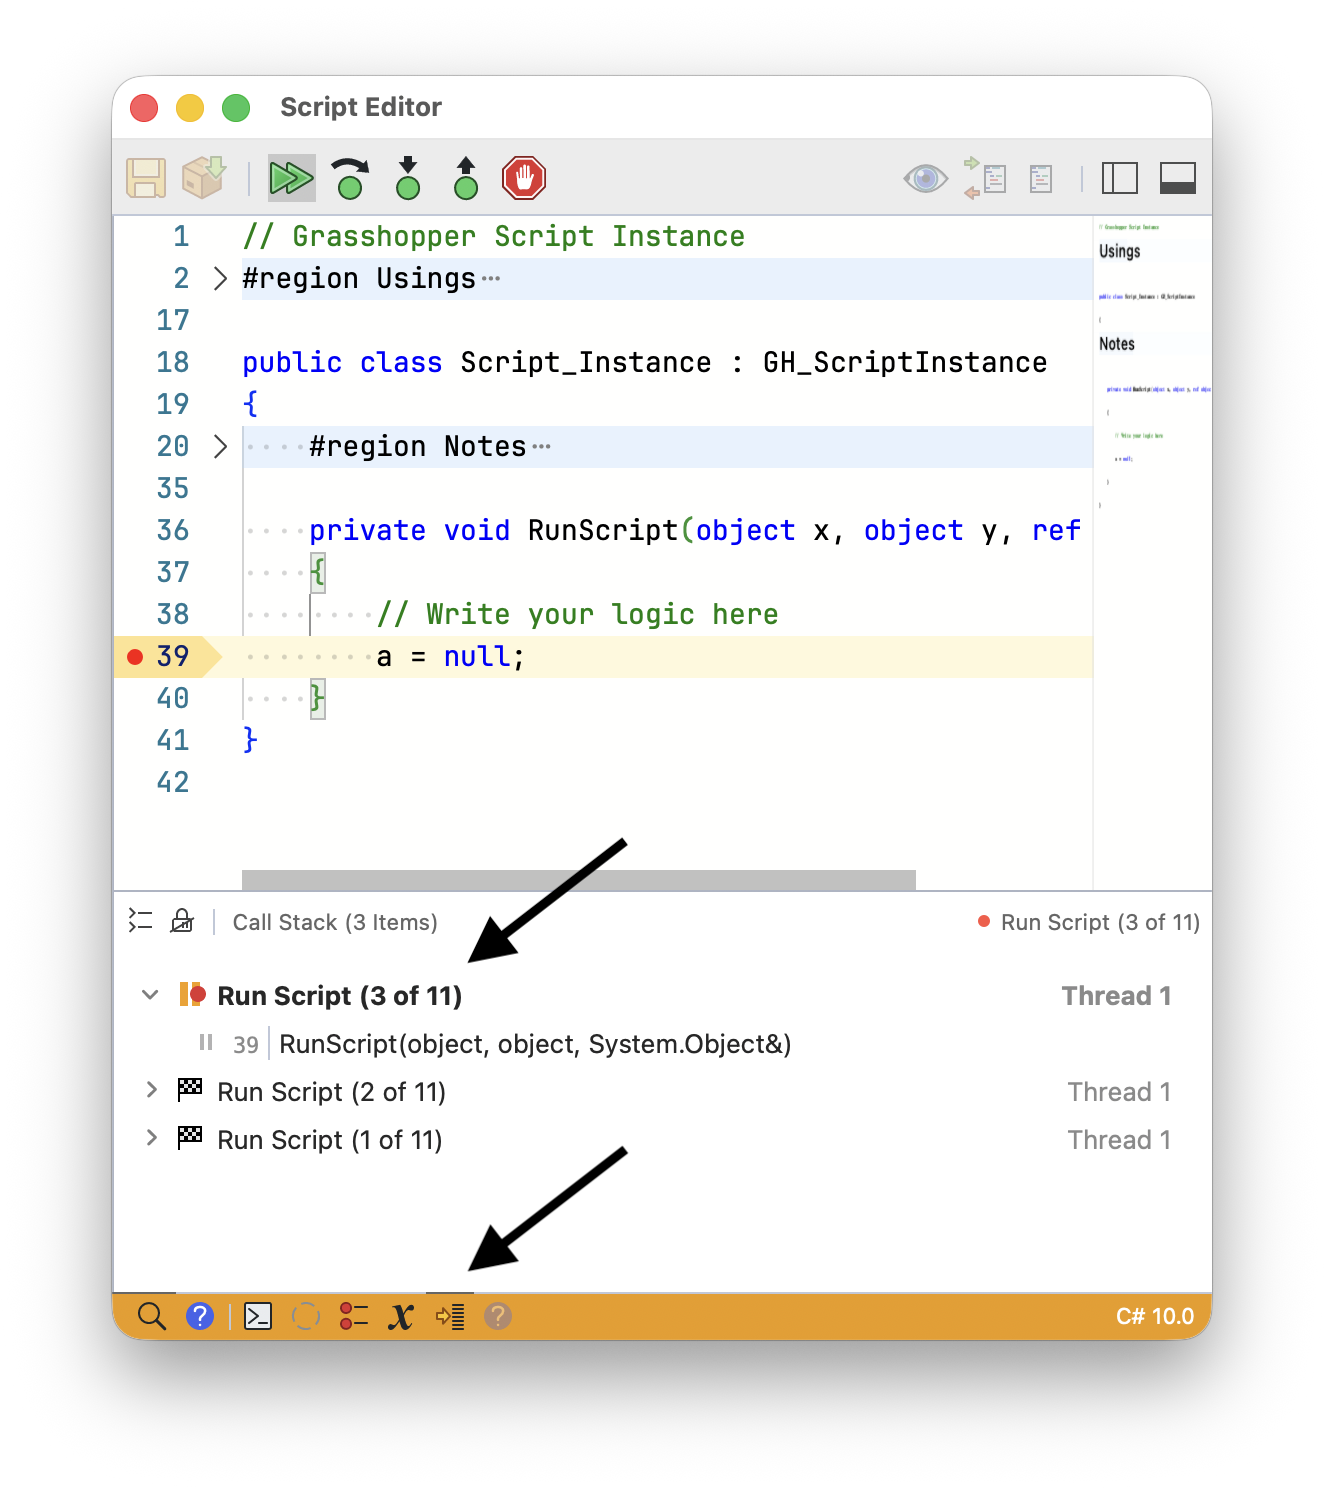
Each item shows its state: awaiting, paused, paused on a breakpoint, completed, errored, or disconnected.
Use Collapse Call Stack to collapse expanded frames, and Toggle Follow Locks to follow one specific run when more than one is going on.
Pausing on Exceptions
The Breakpoints panel header also sets when the debugger pauses on an exception. The same options are in Run > Pause On Exception Policy:
- Pause on Any Exception (Handled or not)
- Pause on Unhandled Exceptions (Default)
- Do Not Pause on Exceptions